Key Takeaways:
- The ACT is scored between 1 – 36 and includes a Composite Score and section scores for English, Math, Reading, and Science.
- The 50th percentile for the ACT is currently between 18 and 19.
- ACT percentiles are percentages that show you how well you did compared to other students who also took the exam.
- Scoring well on the ACT could boost your college acceptance odds or qualify your for scholarships.
 The ACT is a standardized test required by most four-year colleges and universities in the United States. Your scores can impact your acceptance chances at these schools, especially competitive ones. Breaking down your ACT score can help you understand where you stand and make a game plan for your exam retake. Here’s an overview of how the ACT is scored and answers to common questions, such as “What is a good ACT score?” and “How can I find my scores?” Checking ACT score percentiles will give you a more realistic overview of your competition.
Table of Contents:
- What is the ACT
- ACT Scoring
- ACT to SAT Score Conversion
- ACT Percentiles and What is Considered “Good”
- How to Find Your Scores and What to Do While You Wait
- Benefits of Good ACT Scores
- Commonly Asked ACT Scoring Questions
What is the ACT?
The ACT is a standardized test or entrance exam used by colleges and universities during admissions cycles. Questions are multiple choice and, as of 2024, cover English, mathematics, science, and reading. There is also an optional writing exam.
Here’s a quick breakdown of what the ACT covers:
| Subject | # of Questions | Time Allotment | Areas Tested |
|---|---|---|---|
| English | 75 questions | 45 minutes | English-related topics, including grammar, editing, and sentence structure |
| Mathematics | 60 questions | 60 minutes | Math skills typically covered by the start of 12th grade, including algebra, trigonometry, and geometry |
| Science | 40 questions | 35 minutes | Covers problem-solving skills, reasoning, and interpretation |
| Reading | 40 questions | 35 minutes | Covers reading skills and logical thinking |
| Writing (Optional) | 1 essay | 40 minutes | Write an essay on the prompt and provide and defend your perspective |
Note, the ACT test is changing and the science section will soon be optional.
How is the ACT Scored?
The ACT is scored between 1 and 36. The higher the score, the better you did. Students will receive a score for each section (English, Math, Science, and Reading) as well as a Composite Score. The Composite Score is the average of the four sections’ results.
For example, if you scored 28 in English, 27 in math, 29 in science, and 31 in reading, your score would be 28.75. The ACT rounds to the nearest whole number, so officially you would have a Composite Score of 29.
How is the ACT Writing Section Scored?
The optional ACT Writing section is scored between 2 and 12. However, the ACT report actually provides five different scores for the essay. Students receive results on single subject-level writing, Ideas and Analysis, Development and Support, Organization, and Language Use and Conventions.
Two officials will read your essay and score it on each of these sections between 1 and 6. These numbers are combined for your score out of 12.
Overall, the writing portion is scored based on how the student stated their perspective on the provided prompt, why it’s their selection over the other perspectives, idea development, reasoning, organization, communication, and English writing skills.
Do Your ACT Scores Matter?
Yes! If you’re planning on going to college, your ACT scores matter. Most colleges still require the ACT or one of the other standardized tests – the SAT and the Classic Learning Test (CLT). Colleges often look for specific scores from their applicants, and a higher score could mean a higher chance of acceptance.
However, several schools are changing their admissions processes and how they look at ACT, SAT, and CLT scores. Some have completely done away with the requirement and don’t accept the tests, while others have listed the application component as “optional” or “recommended.”
We recommend taking the ACT or one of the other options if you’re planning to go to college, even if none of the schools on your list require them. You might want to add another college to your list at a later date that does require a standardized test and it could be too late to sign up. For colleges that have standardized tests as optional or recommended, submitting your scores can show initiative and give you a boost over students who didn’t submit their results.
The ACT writing exam can be a solid choice if you’re planning to go into a writing-heavy major, but less than 10 colleges recommend submitting ACT writing scores. Only the United States Military Academy at West Point still requires an ACT essay or similar.
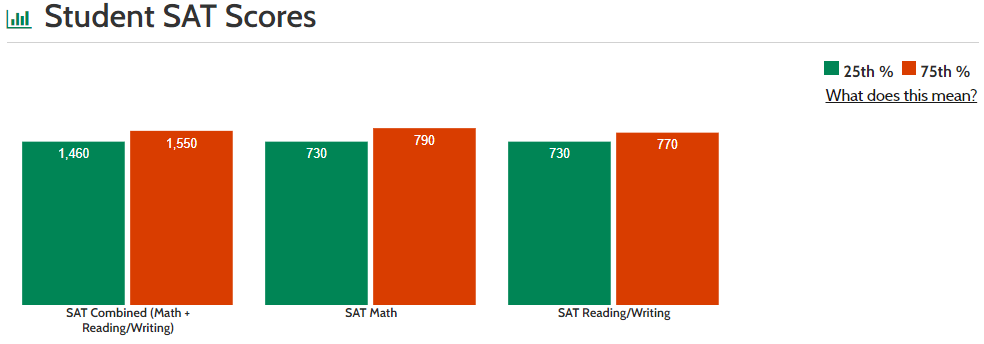
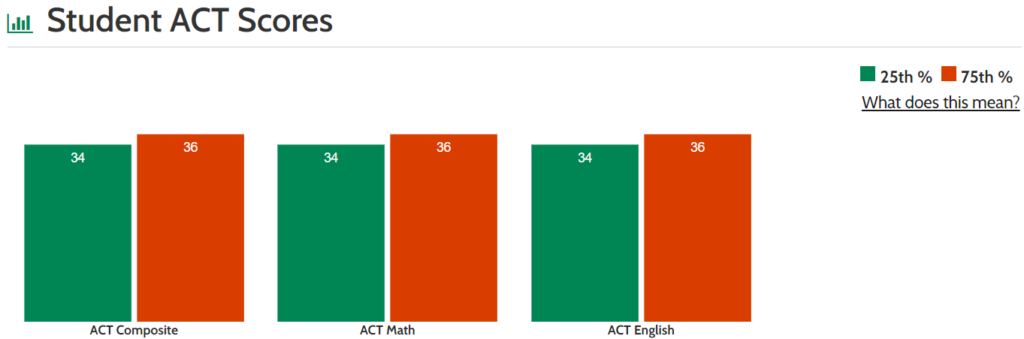
How is the SAT Scored Compared to the ACT?
If you took both the SAT or ACT (or both as practice exams), understanding how your ACT score stacks up against your SAT score can give you insight into which is the best test for you. Keep in mind, however, this isn’t an apples-to-apples conversion and can’t predict how well you’d do on the SAT if you took the ACT.
This table breaks down the ACT to SAT conversions:
What is a Good ACT Score?
A “good” ACT score is subjective. The answer isn’t always clear, but the best way to answer this question is, “It depends.”
A good ACT score depends entirely on you, your goals, and the school you wish to apply to. For example, if you’re struggling with this test, getting a 17 can be considered good. However, this score will likely only qualify you for less competitive schools. If you’re aiming for reach schools, you’re going to need to score higher.
What are ACT Percentiles?
One way to determine a “good” ACT score is to look at the previous years’ percentiles. The ACT calls them “National Ranks,” and your percentile can actually be seen on your ACT score report. The National Ranks are based on results from the previous three years’ graduates.
Using this data, the Composite Score 50th percentile, or median, is between 18 and 19. If you received a 19 Composite Score , you performed better than 55% of others taking the ACT. A 31 would place you at the 96th percentile, meaning you scored higher than 96% of students.
Here’s a look at the percentiles that are from ACT-tested high school graduates from 2022, 2023, and 2024, which will be used for ACT tests between September 2024 and August 2025.
| Score | English | Math | Reading | Science | Composite |
|---|---|---|---|---|---|
| 36 | 100 | 100 | 100 | 100 | 100 |
| 35 | 99 | 99 | 98 | 99 | 99 |
| 34 | 96 | 99 | 96 | 98 | 99 |
| 33 | 94 | 98 | 94 | 97 | 98 |
| 32 | 92 | 97 | 91 | 96 | 96 |
| 31 | 91 | 96 | 89 | 95 | 95 |
| 30 | 89 | 94 | 86 | 93 | 93 |
| 29 | 88 | 93 | 84 | 90 | 90 |
| 28 | 86 | 91 | 82 | 90 | 88 |
| 27 | 84 | 88 | 80 | 88 | 85 |
| 26 | 82 | 84 | 77 | 85 | 82 |
| 25 | 79 | 79 | 74 | 82 | 78 |
| 24 | 75 | 74 | 71 | 77 | 74 |
| 23 | 71 | 70 | 66 | 71 | 70 |
| 22 | 65 | 65 | 61 | 64 | 64 |
| 21 | 60 | 61 | 55 | 58 | 59 |
| 20 | 55 | 58 | 50 | 51 | 53 |
| 19 | 49 | 54 | 44 | 45 | 47 |
| 18 | 45 | 49 | 39 | 39 | 41 |
| 17 | 41 | 42 | 34 | 32 | 35 |
| 16 | 37 | 33 | 29 | 26 | 28 |
| 15 | 32 | 21 | 24 | 19 | 22 |
| 14 | 25 | 11 | 19 | 14 | 16 |
| 13 | 19 | 4 | 14 | 10 | 10 |
| 12 | 15 | 1 | 10 | 7 | 5 |
| 11 | 11 | 1 | 5 | 4 | 2 |
| 10 | 7 | 1 | 3 | 3 | 1 |
| 9 | 3 | 1 | 1 | 1 | 1 |
| 8 | 2 | 1 | 1 | 1 | 1 |
| 7 | 1 | 1 | 1 | 1 | 1 |
| 6 | 1 | 1 | 1 | 1 | 1 |
| 5 | 1 | 1 | 1 | 1 | 1 |
| 4 | 1 | 1 | 1 | 1 | 1 |
| 3 | 1 | 1 | 1 | 1 | 1 |
| 2 | 1 | 1 | 1 | 1 | 1 |
| 1 | 1 | 1 | 1 | 1 |
What ACT Score Do You Need to Get Into College?
The ACT score required depends on the college you’re applying to. Some less competitive colleges will accept as low as 12 or 13 Composite Scores. However, more competitive colleges will want higher results.
For example, Harvard University only accepts 3% of applicants, and a majority of accepted students during the last admissions cycle earned between 34 and 36. Florida State University is also competitive at 25.2%, and most accepted students had ACT scores between 26 and 31.
Very few colleges have published ACT score requirements or “minimums” for their applicants.
Keep in mind that scoring high on the ACT doesn’t automatically result in an acceptance letter. Your standardized test scores are only one part of your application package.
How To Find Your ACT Score
Your ACT scores, when released, can be found on your MyACT Account that you created to sign up for the exam in your ACT High School Report. The report includes your score, the score range, the ACT College Readiness Benchmarks, detailed results, and your ranking/percentile (national and state). It will also include advice for college planning, including educational plans and possible college choices.
In general, results will be released two weeks after you sat for the exam. However, there can be delays up to 10 weeks if you haven’t paid your registration or related fees, your admission ticket information doesn’t match your day of test information, documents arrived late from the testing center, or there were irregularities reported by the testing center.
What Should You Do While You Wait for Your Test Results?
Two weeks can feel like a long time while you’re waiting for your ACT test results! This is a great time to focus on your school work and treat yourself for taking the exam, but there are two other things you can tackle in the meantime, too.
Register for the ACT Again
If possible, register for the ACT again and start preparing for your retake test. You can use the next two weeks to study for the exam, using your experience to guide your plans.
Upcoming test dates can always be seen on the ACT website. For most regular applications, the last ACT test date is in December.
Work on Your College Applications
Your college application is more than your standardized test scores. This is a great time to work on refining or collecting these parts:
- Application forms
- Free Application for Federal Student Aid (FAFSA)
- College essay
- Collecting Letters of recommendation
- Additional materials, such as portfolios if you’re looking at art school
- Volunteering
Benefits of a High ACT Score
There are several benefits of getting a high Composite Score on the ACT! These are just some of the advantages:
1. You Can Increase Your College Acceptance Odds
One of the most obvious benefits of higher ACT or SAT test scores is that it increases your acceptance odds. Most colleges have a range they’re looking for in these exams, but higher is always better.
If you score on the low end of the accepted range, it could put you at a disadvantage against another applicant who has a similar high school GPA, extracurricular activities, and essay. This could very well place you at the cutoff and the student who has the higher score is accepted, while you’re either declined or wait-listed.
The range schools request for is just that: a range. Higher scores are always better when it comes to showing your talents to the admissions department. “Good enough” may not be good enough to get you into your dream school. Some colleges actually receive so many admissions that if your score is too low, you’re automatically declined.
2. You Become Eligible for Some Merit-Based Scholarships
Many students don’t realize that higher ACT scores can actually lead to scholarships or grants from the college, your state, or an organization. Merit-based scholarships can be granted based on your GPA or SAT / ACT scores. Higher test scores could result in significantly lower tuition or even a full ride.
Students should use local resources and online scholarship databases to see if there are any ACT-based awards they may qualify for.
3. You Can Be Accepted to College Honors Programs
Some schools also have honors programs that require high ACT or SAT scores. These can give you access to tools and events that other students don’t have. Some of the perks include field trips, access to Honors only courses, award eligibility, and separate housing with social events. Many of these programs only take standardized tests and grades into account, so a higher ACT score can result in some major benefits.
FAQ About ACT Scores
Here are a few other answers to questions students tend to have about the ACT and their scores.
What is an ACT Superscore?
Your ACT superscore is an average of your four best subject scores from your test attempts. Not all schools accept ACT superscores, but it can be a great way to showcase your abilities if the college does accept them.
How Can I Send my ACT Results to Colleges?
MyACT allows you to select four colleges or universities when you register for free. This means your results will automatically be sent to these schools. Adding schools after you register or adding more than four colleges will require you to pay a fee.
How Much is it To Send ACT Scores?
You can send your ACT score to up to four schools for free if you listed them when you registered. If you decide to apply to another college you did not originally list during your registration, it costs $19 per test date per report as of this edit. For test results that are older than 3 years, there is a $30 archive fee per test date per order. Check the ACT website for up-to-date fees as these costs can change.
For students who have demonstrated financial need, there are fee waivers available.
My ACT Has a Scoring Error – What Should I Do?
You can request a copy of your ACT’s questions and answers as long as your test date and center are eligible. If approved, you will receive the questions, answers, answer key, writing prompt, scoring rubric, writing scores, and scoring instructions. This can be particularly handy if you want to use your previous test as a study guide for your next attempt, but it can also be used to identify scoring errors (though these errors rarely happen).
If you believe your ACT score has errors, however, the ACT offers the Score Verification Service for both portions of the exam (multiple choice and writing). You can request that the ACT double-check your results for up to 12 months after your test date. Representatives will review your response and verify your score.
There is a fee for this service, but if errors are found, your scores will be adjusted and the fee will be refunded.
What if There are Other Errors, Not Related to Scoring, On My ACT Results?
If you find other mistakes on your ACT report or MyACT account, reach out to ACT Customer Care as soon as possible. You can also change your address if you have moved by contacting them.
How Do I Access My ACT Scores if I’m a Non-Traditional Student?
If you’re heading back to school after several years and need an ACT/SAT score to apply, you can still access your ACT score report by logging into MyACT. If you have problems accessing your account, you can reach out to the ACT for further assistance.
It’s important to note, though, that sending older ACT scores to colleges costs more money.
How Can I Improve My ACT Score?
There are tons of great resources out there to help you prepare and do your best on the ACT. Whether you are taking it for the first time, or you want to retake it hoping for a better score, check out these resources:
- 6 Helpful ACT Test Prep Websites
- How to Prepare for the ACT
- 16 Critical Math ACT Math Formulas You NEED to Know
Does My School Require My ACT Scores?
Colleges can change their application requirements year-to-year. Always check your potential colleges’ website for up-to-date application requirements, including standardized test requirements. If you have any questions, be sure to reach out to the admissions department as soon as possible.
By breaking down your ACT score and understanding it inside and out, you can create a game plan for future retakes. Your ACT High School Report will detail how well you did on each section, and you can use that information to put more effort into your weaker areas to achieve your goal score. Taking a look at your percentile can give you further insight into college acceptance chances.
College Match and college profiles on College Raptor can help you create your ACT score goal. Find out what your schools are looking for on the ACT and SAT by signing up for free today.