
Source: Flickr user cityyear.
Many students wonder about average ACT scores–but, what does that mean, exactly?
The answer can really take two distinct forms.
First, there is the question of what an “average” ACT score might be for all students. In this case, students generally just want to know how their score compares to everyone else who took the test. In this case, ACT publishes a distribution of scores for each year, showing what percentage of students received each score–from 1 to 36–on each of the subtests, as well as the composite score.
But, the second, and likely more relevant way to evaluate an “average” ACT score is to consider what would be an average–or typical–score for students who are enrolled at a specific college. After all, most students want to know if their score is “good enough” to get into the college they are hoping to attend, right?
This is a separate case, but, luckily, many colleges publish data on the distribution of ACT scores for students that were accepted to that school. As a student, this means that you can compare your ACT score to the score of other students who were accepted to get an idea for how you would compare to other students at that college.
Both of these metrics can be valuable to you as a student, but which one matters more will depend on your educational goals. If you’re interested in attending a highly selective college, then your score will need to be closer to the average student at that school, which is almost certainly much higher than the average ACT score of all students across the country.
Either way, there is useful data that you can use to see how your score stacks up and whether you are above or below the “average”–really, median, in most cases–ACT score.
1. Median ACT Scores – National Average ACT Score
Each year, the ACT publishes information on the distribution of ACT scores. In other words, if you want to know how your score compares to everyone else’s score, you can look at this chart to see. Did you score higher than 50% of other students? 75%? 99%?
Note that these aren’t average in the sense that it’s the mean of all scores. Instead, ACT reports based on the percentile for each score awarded.
This information can be useful in the sense that students can get a general idea of how they “stack up”. against everyone else in the country. But, keep in mind that it’s just a general benchmark and isn’t all that useful for a single student considering specific colleges.
ACT distribution for 2014:
| Score | Composite Percentiles | English Percentiles | Math Percentiles | Reading Percentiles | Science Percentiles |
| 36 | 99 | 99 | 99 | 99 | 99 |
| 35 | 99 | 99 | 99 | 99 | 99 |
| 34 | 99 | 98 | 99 | 99 | 99 |
| 33 | 99 | 97 | 98 | 97 | 98 |
| 32 | 98 | 95 | 97 | 95 | 98 |
| 31 | 97 | 94 | 96 | 93 | 97 |
| 30 | 95 | 92 | 95 | 90 | 95 |
| 29 | 93 | 90 | 93 | 87 | 94 |
| 28 | 90 | 88 | 91 | 84 | 93 |
| 27 | 87 | 85 | 88 | 81 | 90 |
| 26 | 83 | 82 | 84 | 78 | 87 |
| 25 | 79 | 79 | 79 | 75 | 83 |
| 24 | 74 | 74 | 73 | 72 | 77 |
| 23 | 68 | 69 | 67 | 66 | 70 |
| 22 | 62 | 64 | 61 | 61 | 63 |
| 21 | 56 | 58 | 56 | 56 | 56 |
| 20 | 49 | 51 | 52 | 48 | 48 |
| 19 | 42 | 44 | 47 | 42 | 39 |
| 18 | 36 | 39 | 42 | 36 | 32 |
| 17 | 29 | 35 | 36 | 30 | 26 |
| 16 | 23 | 31 | 27 | 25 | 21 |
| 15 | 17 | 26 | 15 | 20 | 16 |
| 14 | 12 | 20 | 6 | 16 | 12 |
| 13 | 7 | 16 | 2 | 11 | 9 |
| 12 | 4 | 12 | 1 | 7 | 6 |
| 11 | 1 | 10 | 1 | 4 | 4 |
2. “Average” ACT Scores at Each College
Much like the national distribution, many colleges also report the distribution of scores for accepted students at their college.
In this case, a student can see exactly how they compare with other students who were admitted to a specific college. These distributions are represented as a 25th and 75th percentile, so students can see if they call within the middle 50% of admitted students. This can tell a student not only how likely they are to be admitted (some students can gain admissions without falling in this range, but about half of all admitted students, by definition, will fall between the 25th and 75th percentile) but also how well they might fit in academically at that college. Are they likely to perform much higher than other students on campus, or would they feel behind their peers?
Again, this isn’t a true “average” (that figure is not generally reported), but it does give students a way to evaluate their ACT score against other students at a particular college.
See these examples from College Raptor:
Stanford University average ACT scores
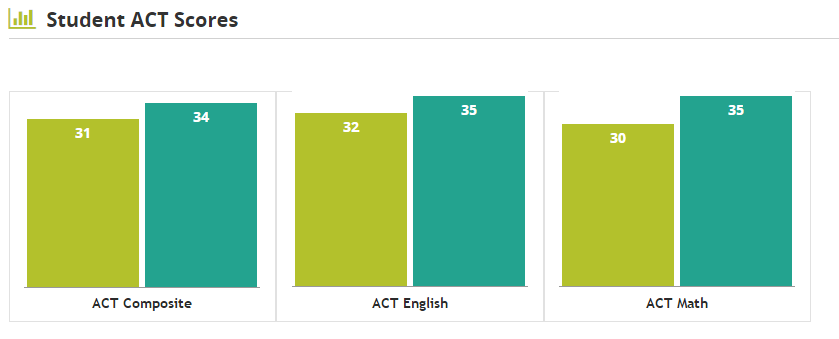
(via College Raptor)
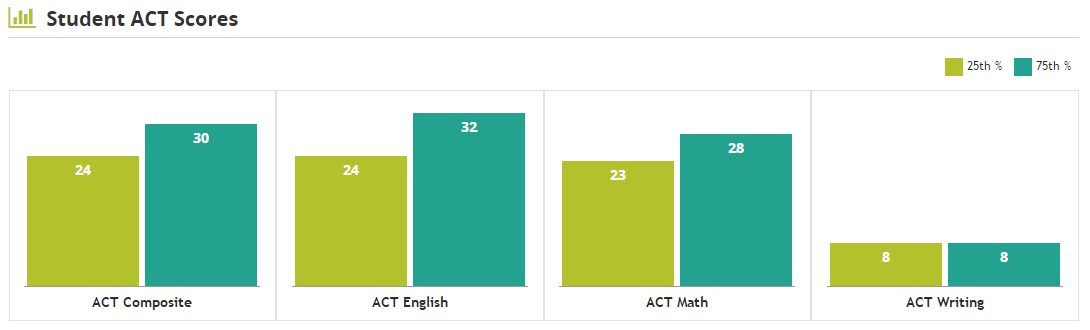
University of North Carolina at Chapel Hill average ACT scores

(via College Raptor)
Auburn University average ACT scores
(via College Raptor)
Use College Raptor to discover personalized college matches, cost estimates, acceptance odds, and potential financial aid for schools around the US—for FREE!