What, would you guess, is the most unique major in your state?
Some states’ most unique majors seem to make sense based on industries in the state. For instance, Tennessee has around 12 times as many arts, entertainment, and media management majors than the rest of the country (per college grad/per year), which can be chalked up to Nashville’s huge music industry.
Additionally, Nevada produces nearly 16 times as many hospitality administration and management majors than the rest of the country, and DC educates about 25 times more international relations majors.
Some states are perhaps less intuitive. Who’d have guessed the most unique major in Ohio is zoology, or that in California it’s cognitive science?
Other states’ majors are striking because of how over-represented they are. For instance, the proportion of students in Maine who study marine sciences is 165 times higher than the rest of the country. Students in Rhode Island are 99 times more likely to major in woodworking.
The map below illustrates our findings for each state. Note that the names of some majors have been shortened slightly to better fit the map.
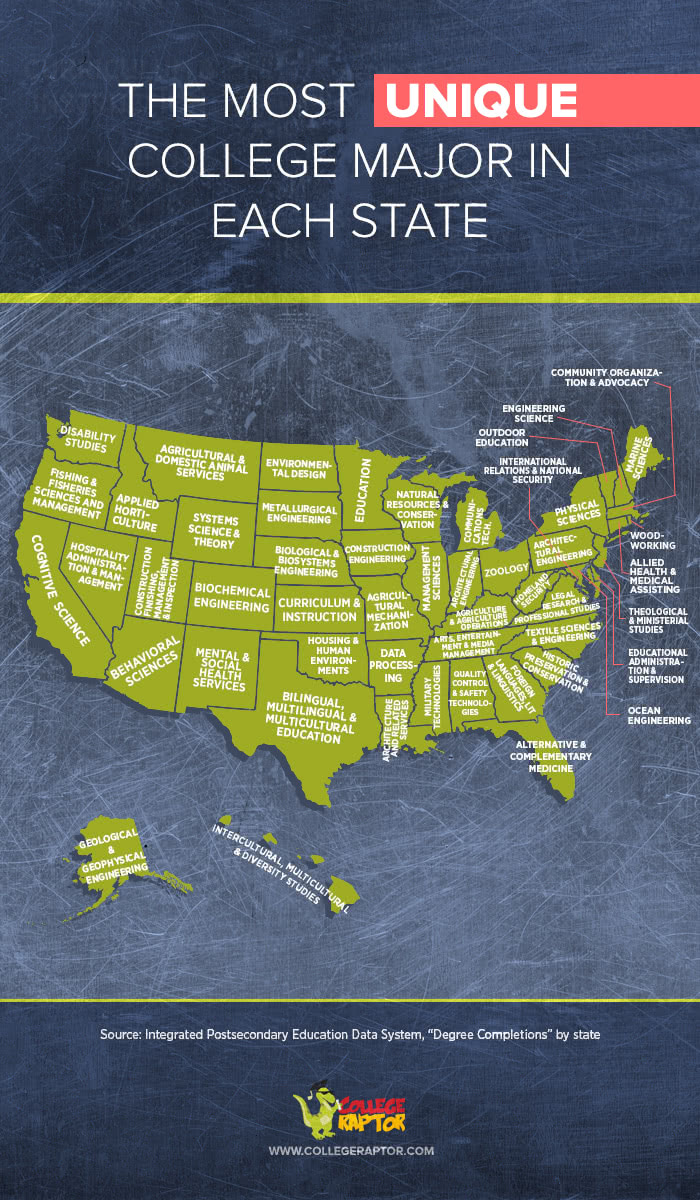
Here’s some data on each state’s most unique majors. The state percent indicates what percentage of all 2013 graduates by state received a degree in the most unique major in their state. The far right column indicates how many times the national average this percentage is.
| State | Major | Percentage of state | Scaled score versus national |
| AK | Geological/Geophysical Engineering. | 0.35% | 46.98 |
| AL | Quality Control and Safety Technologies/Technicians. | 1.86% | 28.37 |
| AR | Data Processing. | 0.15% | 40.25 |
| AZ | Behavioral Sciences. | 5.18% | 18.86 |
| CA | Cognitive Science. | 0.19% | 5.81 |
| CO | Biochemical Engineering. | 0.12% | 47.22 |
| CT | Allied Health and Medical Assisting Services. | 0.76% | 20.33 |
| DC | International Relations and National Security Studies. | 11.60% | 24.87 |
| DE | Educational Administration and Supervision. | 0.62% | 64.32 |
| FL | Alternative and Complementary Medicine and Medical Systems. | 0.27% | 9.91 |
| GA | Foreign Languages, Literatures, and Linguistics, Other. | 0.21% | 15.81 |
| HI | Intercultural/Multicultural and Diversity Studies. | 0.47% | 55.03 |
| IA | Construction Engineering. | 0.21% | 10.63 |
| ID | Applied Horticulture and Horticultural Business Services. | 0.35% | 12.84 |
| IL | Management Sciences and Quantitative Methods. | 1.21% | 5.89 |
| IN | Architectural Engineering Technologies/Technicians. | 0.34% | 17.97 |
| KS | Curriculum and Instruction. | 0.71% | 76.05 |
| KY | Agriculture, Agriculture Operations, and Related Sciences, Other. | 0.31% | 27.40 |
| LA | Architecture and Related Services, Other. | 0.21% | 25.15 |
| MA | Community Organization and Advocacy. | 0.76% | 7.96 |
| MD | Ocean Engineering. | 0.15% | 16.22 |
| ME | Marine Sciences. | 0.35% | 165.44 |
| MI | Communications Technology/Technician. | 0.11% | 13.55 |
| MN | Education, Other. | 0.47% | 5.87 |
| MO | Agricultural Mechanization. | 0.10% | 5.90 |
| MS | Military Technologies and Applied Sciences, Other. | 0.18% | 74.33 |
| MT | Agricultural and Domestic Animal Services. | 0.40% | 25.38 |
| NC | Textile Sciences and Engineering. | 0.32% | 29.64 |
| ND | Environmental Design. | 1.21% | 32.08 |
| NE | Biological/Biosystems Engineering. | 0.20% | 24.30 |
| NH | Engineering Science. | 0.70% | 33.58 |
| NJ | Theological and Ministerial Studies. | 1.26% | 7.67 |
| NM | Mental and Social Health Services and Allied Professions. | 1.25% | 10.83 |
| NV | Hospitality Administration/Management. | 9.16% | 15.73 |
| NY | Physical Sciences, Other. | 0.16% | 8.53 |
| OH | Zoology/Animal Biology. | 0.56% | 5.29 |
| OK | Housing and Human Environments. | 0.33% | 24.70 |
| OR | Fishing and Fisheries Sciences and Management. | 0.25% | 20.15 |
| PA | Architectural Engineering. | 0.10% | 9.17 |
| PR | Business Operations Support and Assistant Services. | 1.65% | 71.82 |
| RI | Woodworking. | 0.13% | 99.21 |
| SC | Historic Preservation and Conservation. | 0.14% | 23.66 |
| SD | Metallurgical Engineering. | 0.23% | 44.74 |
| TN | Arts, Entertainment,and Media Management. | 1.39% | 12.18 |
| TX | Bilingual, Multilingual, and Multicultural Education. | 0.16% | 12.26 |
| UT | Building/Construction Finishing, Management, and Inspection. | 0.16% | 12.26 |
| VA | Legal Research and Advanced Professional Studies. | 0.16% | 25.78 |
| VT | Outdoor Education. | 0.27% | 75.43 |
| WA | Disability Studies. | 0.26% | 7.66 |
| WI | Natural Resources and Conservation, Other. | 0.14% | 12.71 |
| WV | Homeland Security. | 0.16% | 65.84 |
| WY | Systems Science and Theory. | 0.56% | 53.41 |
* Six states weren’t assigned their 1st most over-represented major due to ties. MO tied three times, 1st with NE, then with OK, then with MT. MT tied first with SD, then with AK. OH tied with KY. PA tied with WY. WI tied with DE. WV tied with MS. In each case, the state with the more dramatic over-representation was assigned the major from the tie and the other state was assigned its next most over-represented major.
Methodology: Using data from the Integrated Post-secondary Education Data System, we found the number of 2013 graduates in each major. We broke this up by state and found the percentage of graduates, nation and statewide, in each major. We divided the state percentage by the national percentage to find how over-represented a major was in a state. To be considered for our analysis, a major had to claim at least 0.1 percent of 2013 graduates in a state. We handled ties by the method described above