The graphs in the ACT math section fall under the coordinate geometry category. This part accounts for as many as 9 questions out of 60. Scoring full points in this section can help to boost your overall score.
These are the most common graphs you will need to know for the ACT Math section:
Bar Graphs
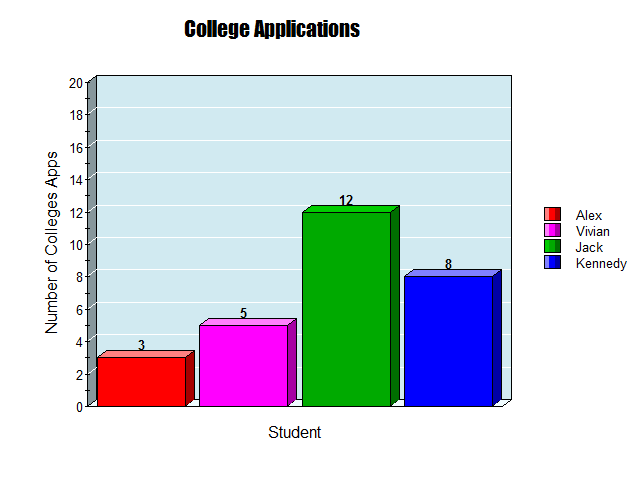 These are the easiest types of graphs to draw and understand as they are very straightforward in the way they convey information. Bar graphs typically include bars that are one cell wide and elongated. The height of each bar depicts the quantum associated with it.
Typically, the graphs can be as simple as presenting the data for one set or can be several degrees more complicated and depict several measured values for multiple independent things at once.
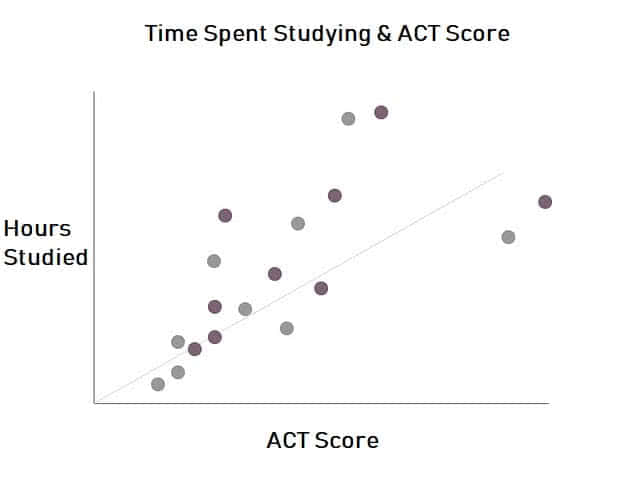
Scatterplots
Flickr user Jon Gosier
Scatterplot graphs depict the changing relationships between two sets of data. They are mostly used to showcase unstable relationships where the relationship is not totally predictable.
Line Graphs
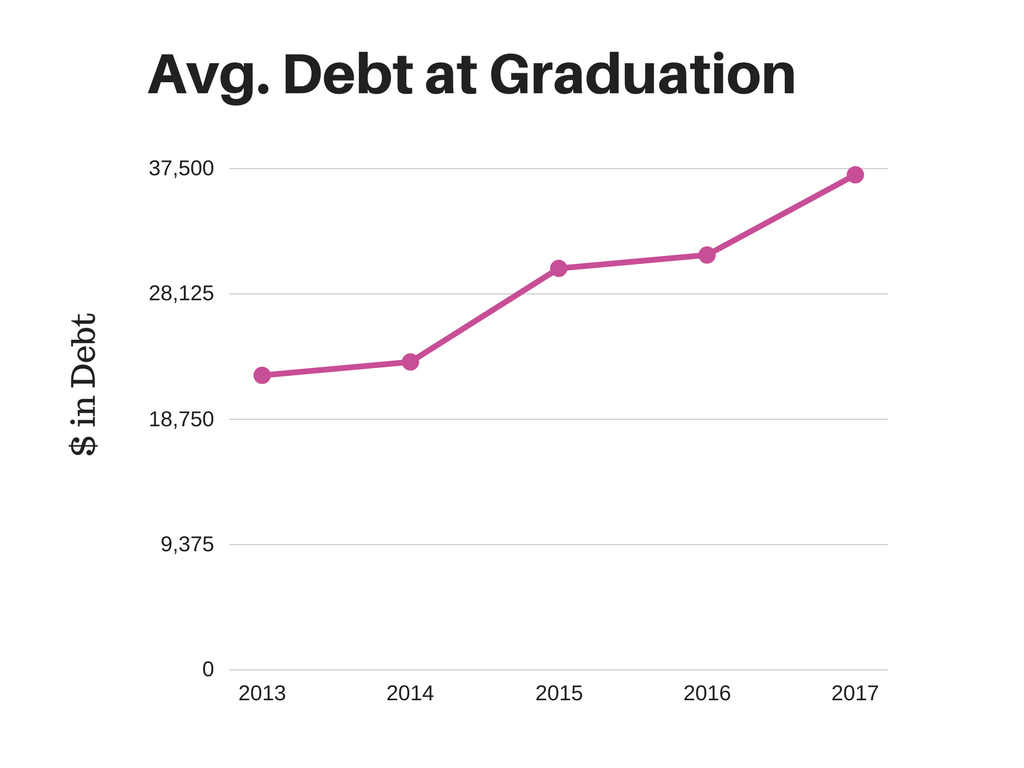 They are similar to scatter plots, but consist of a line connecting the dots on a scatterplot. These help to better measure variations across different ranges and understand the correlation between the sets in a better way. They can also contain correlations between multiple sets and more than one line to better compare relations between different sets of data.
[Note: Data represented in graphs is purely for example, not accurate]
Use College Raptor to see how your ACT score affects your acceptance odds!