Source: Flickr user 53272102@N06.
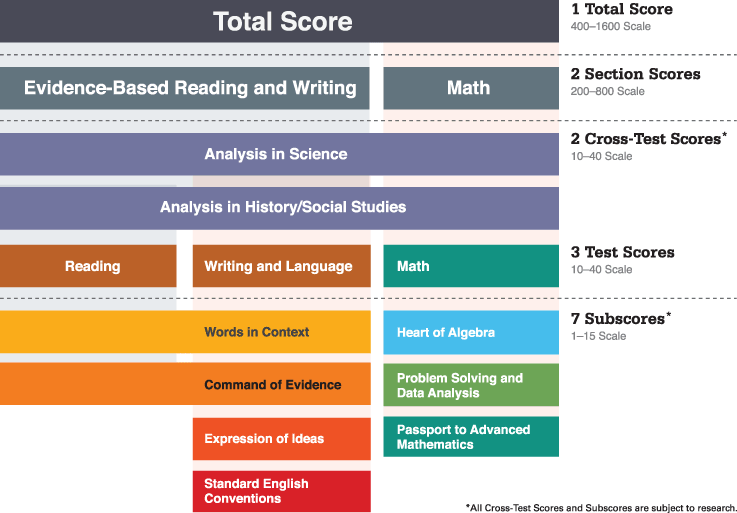
Before we start talking averages, you need to know that the way the SAT is actually scored has been updated along with the new version. Gone are the days of the 2400 perfect score. Instead, students are now able to top out at 1600.
Not only has the highest score possible changed, but so has the lowest. So the range is now 400-1600. This score is comprised of 200-800 points possible on two section tests. For more information on how the new scores are broken down, visit College Board’s score structure page.

SAT score breakdown from College Board.
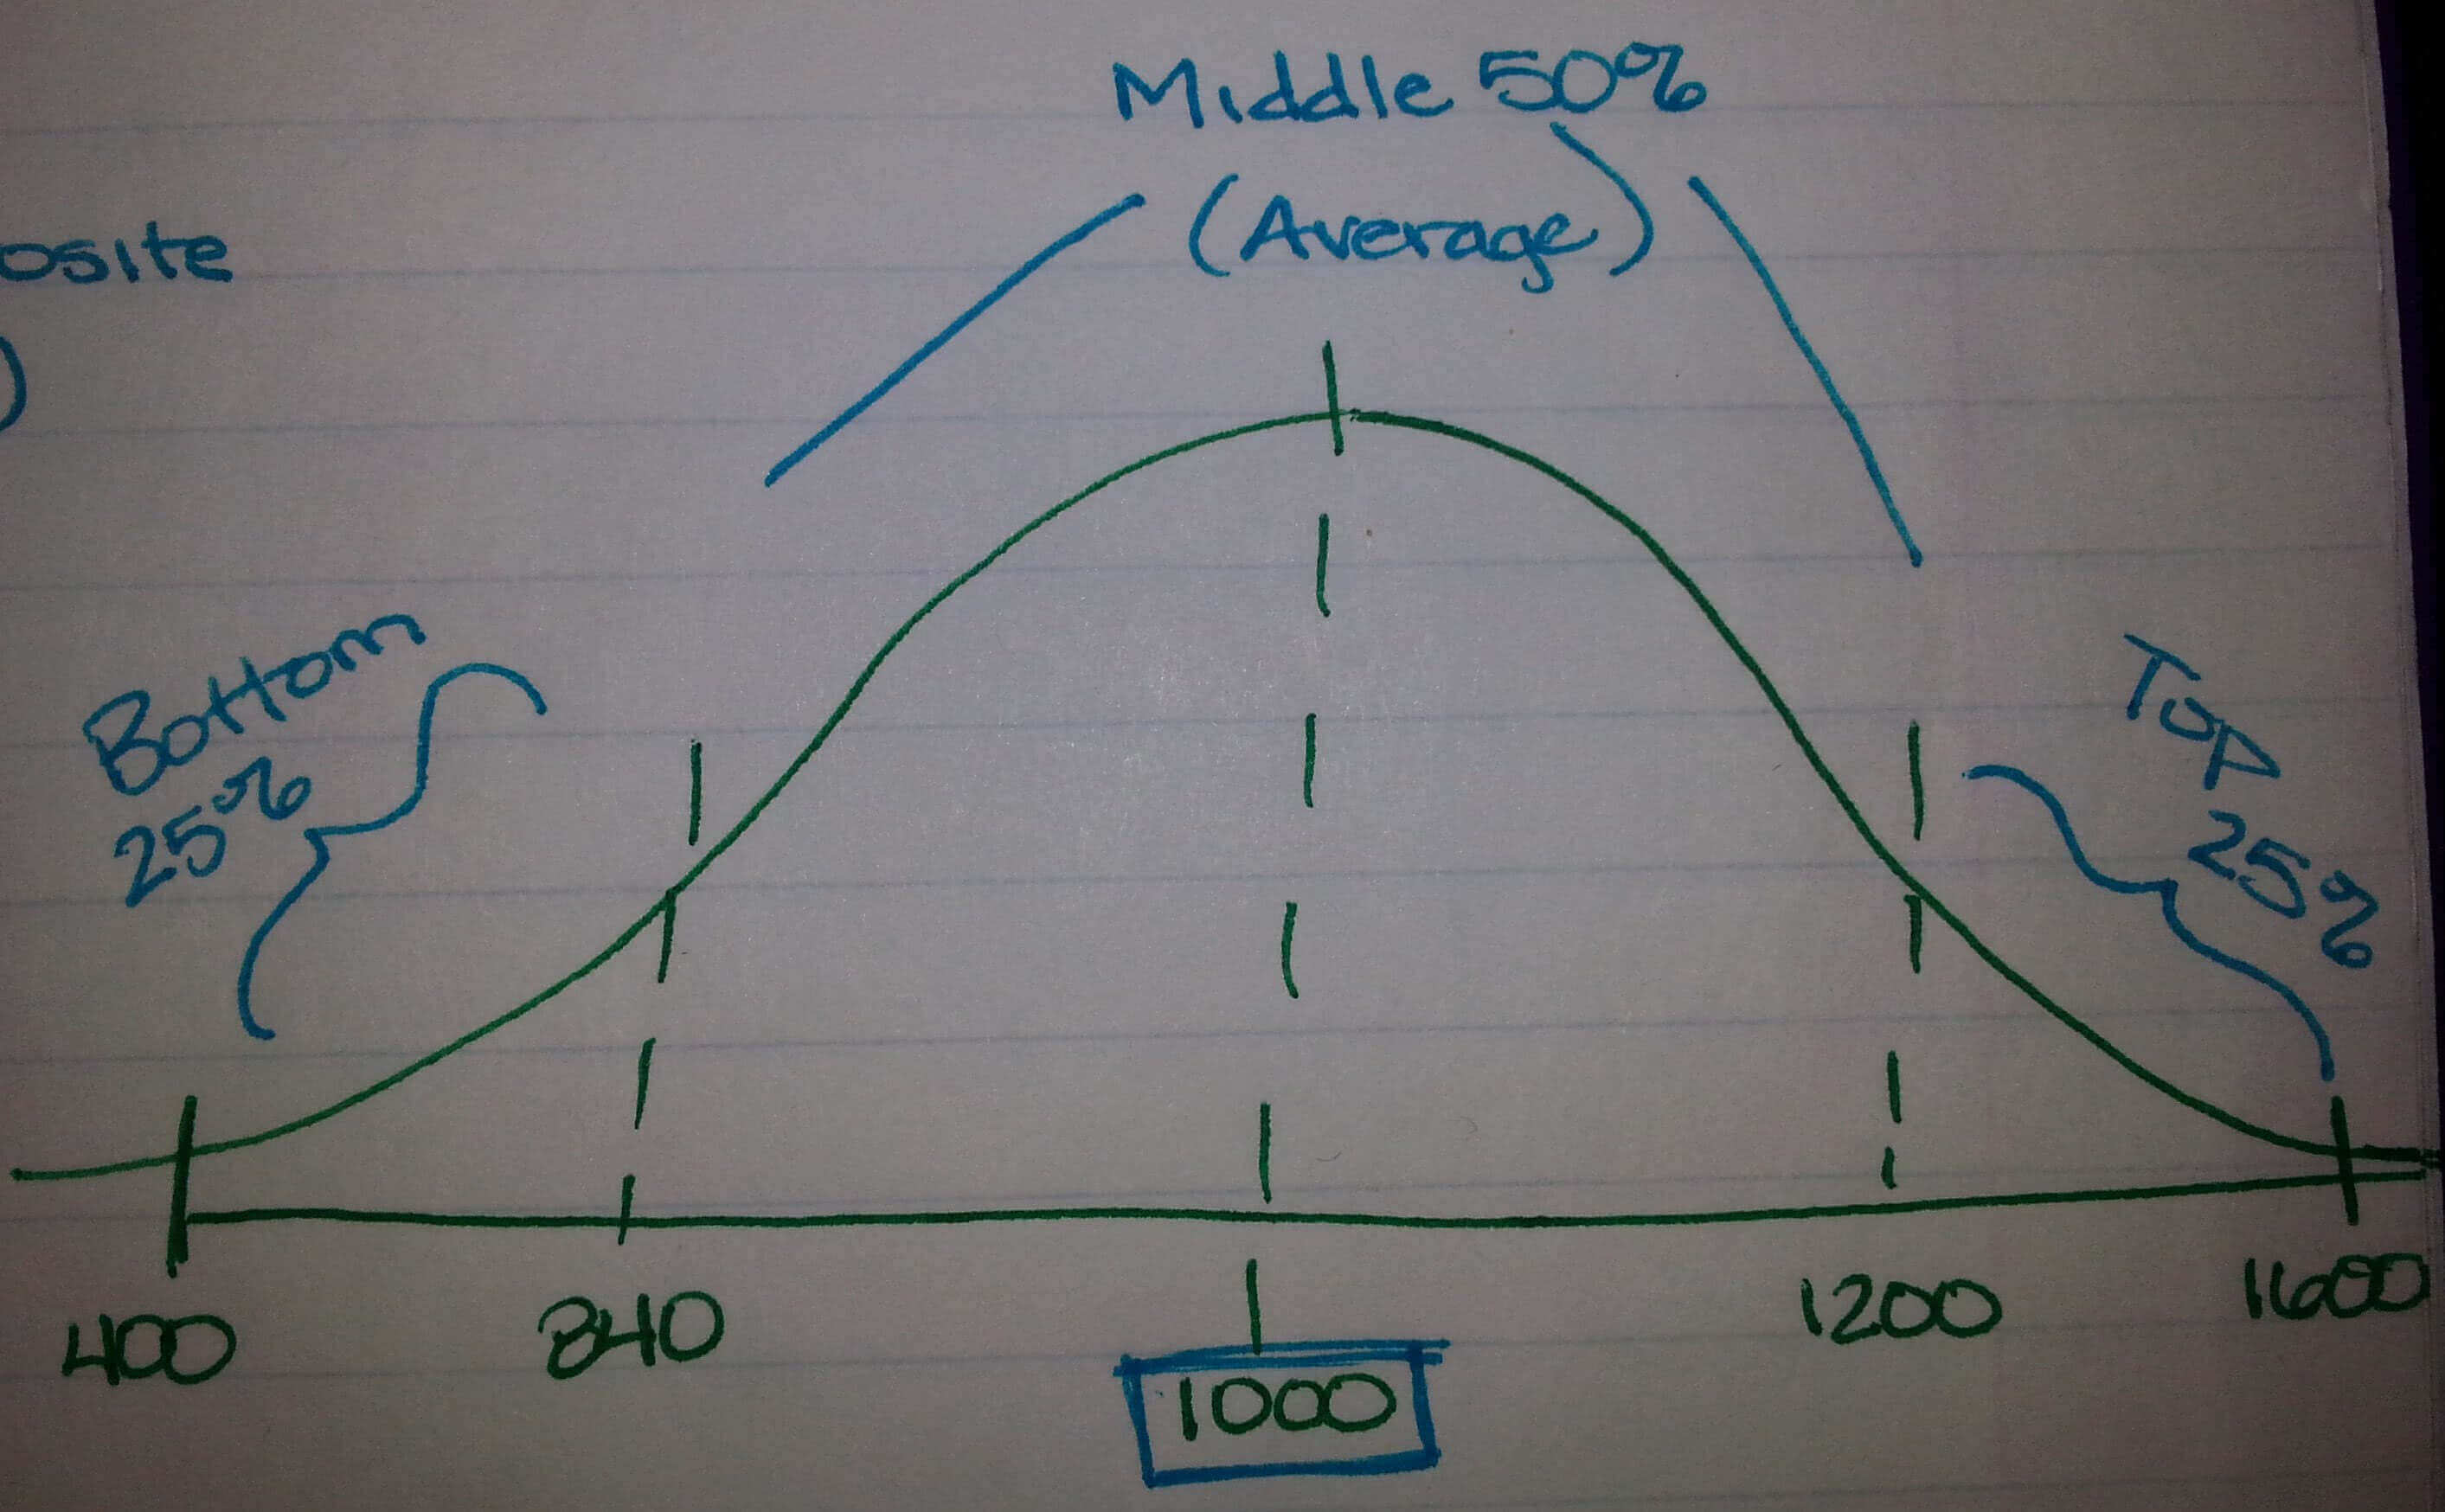
Because the scores have changed for the new SAT, the average has as well. If we draw out a new curve for the updated SAT, the average score becomes 1000.
The score report you receive after taking the test will contain a few key pieces of information in regards to SAT score averages.
Composite SAT Score
The composite score is your score out of 1600. This is the score that you can use to compare yourself to those accepted at the colleges you’re interested in.
Keep in mind that some schools are using super scores. This basically means that if you send them all of your SAT scores they will use the highest score for each section and calculate a new score based on that. Your Superscore will be higher than your individual composite scores, so it’s a pretty good deal.
College Readiness Benchmarks
For each section of the new SAT, you will also be compared to college readiness benchmarks. This means that you will be able to see whether you have the skills necessary for succeeding in college, or if you need to do a bit more work to prepare.
Note: The ACT has started using these benchmarks on their score reports as well.
Score Percentile Ranks
Two percentile rankings will be listed on your score report. The rank you receive tells you what percent of the population you scored above. For example, if you scored at the 78th percentile, that means you scored higher than 78% of the population.
The Nationally Representative Sample percentile rank shows where you stand in relation to all students in the U.S. in your grade.
The User Percentile shows where your score stands in comparison to the students who typically take the test in the U.S., and again it’s based on grade.
When you’re looking at SAT scores remember that each college and university has a different way of using them. Some super score, others require subject tests.
Sure, Stanford’s average SAT score might be 1460 (which I just made up), but that means there are students who score above and below that number.

Average SAT score breakdown in a bell curve
The middle half of test takers scores between 840 and 1200 on the new SAT. Here’s my version of the new SAT score bell curve (a professional artist I am not).
An average is just that, an average–it’s not a cutoff.


