When we’re researching, visiting, or comparing colleges, we often want to know what percentage of students get in, but few of us ask these two very important questions:

“How many stay?” and “How many get out with a degree?”
College graduation rates and college retention rates are often critical to deciding if a college is a good fit. After all, every student should enroll with the intent of staying at that institution and eventually graduating with a degree.
While we often know how hard it is to get in the front door, we should know how many graduate from the school successfully before committing our time and money to an institution.
In addition to the graduation rate, the other important statistic is freshmen retention rates. The retention rate is the percentage of full-time freshmen who continue on as sophomores.
While the admission rate tells us what percentage of students get in, a college’s retention rate tells us what percentage stays in school and the graduation rate tells us what percentage finishes their degree. When making a substantial investment of both time and money, this is also important information to know.
Understanding college graduation rate and retention rate when comparing colleges
In order to fully appreciate this information, you must first have a framework for understanding it.
Retention rate
Knowing the national averages will give you a good barometer for comparison. The national average for retention rate is about 61.1 percent. That is, 61% of freshmen nationally return to their school to enroll in the following fall (2016 data).
Graduation rate
Graduation rates are actually reported in two ways: the percentage of full-time students who graduate in 4 years and the percentage of students who graduate in 6 years. The percentage of students who graduate in 6 years is also a federal government reporting requirement.
Any school that awards federal student aid dollars (which is just about all of them), is required by the Student Right to Know Act, to supply the federal government with certain information. That includes the percentage of students who graduate within 150% of the typical time to a degree (or 6 years at a 4-year college). In 2012, the national average for full-time students at 4-year degree-granting institutions was 59 percent. So, 59% of students graduated in 6 years, nationally.
On websites like College Raptor, you can find both the 6-year AND the 4-year graduation rate. There is some noticeable correlation between the selectivity of the college and higher retention and graduation rates. However, that doesn’t mean that a school that falls below these numbers is a bad place. Additionally, be careful to compare similar colleges or apples to apples.
For example:
| Institution | Freshman Retention Rate | 6-Year Graduation Rate | Acceptance Rate |
| Penn State University | 93% | 86% | 50% |
| University of Wisconsin | 95% | 85% | 54% |
| University of Michigan | 97% | 90% | 27% |
| Franklin & Marshall College | 92% | 87% | 34% |
| Villanova University | 95% | 90% | 36% |
| Gonzaga University | 94% | 83% | 65% |
| Wichita State University | 73% | 43% | 94% |
| Florida Atlantic University | 79% | 49% | 60% |
| Montana State University | 76% | 52% | 83% |
These numbers all tell stories.
Do not eliminate a college just because these numbers are lower than you think they should be. Remember, no school will be perfect.
Sometimes, it’s the students rather than the school
When evaluating the retention and graduation rates of a specific college, remember that students also leave for a variety of reasons that have nothing to do with the college itself. A student may change their major to something that is not offered at the original school. Perhaps a student was homesick or a family situation necessitated a transfer to a school closer to home.
If you really love a school but are concerned about their retention and graduation rates, talk to the admissions office. They may also be concerned about those numbers and have made it a school priority to address and raise those percentages. This may mean they have created new programs or initiatives on campus to help students transition into college, or to help them deal with academic or financial troubles. These programs may also be helpful for you as a student.
Compare college graduation and retention rates using College Raptor
College Raptor provides data about college graduation and retention rates. You can access it from your search results page by selecting the “Academic” view (as shown below).
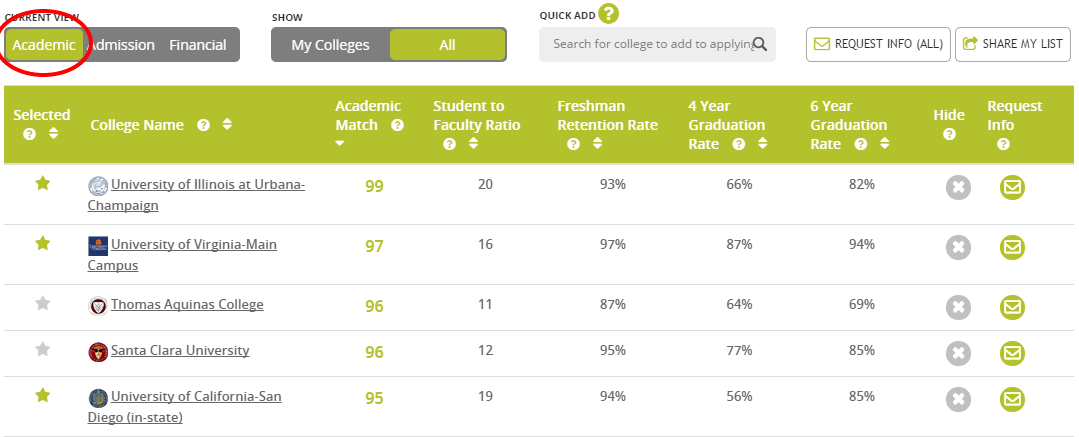
The “Academic” view from the College Raptor results page lets you quickly compare statistics on graduation and retention.
You can also find this information under the “Academic” details page for every college and university (as shown below).
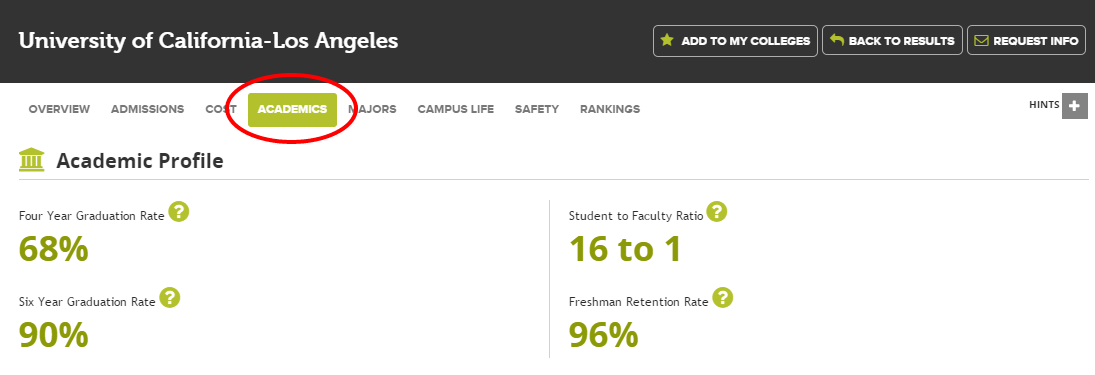
The “Academics” page on College Raptor shows key statistics like the retention and graduation rates at the college or university.
All in all, these two statistics can tell you a lot about a college or university. Just be sure to compare them fairly and understand the story behind the numbers.