- In 2023, the average SAT score was 1028.
- 1,913,742 graduating high school seniors in 2023 took the SAT.
- The mean score for the Evidence-Based Reading section was 520 and the mean score for the Mathematics section was 508.
- SAT scores vary between different demographic groups and college acceptance histories.
How do you stack up to the nation’s average SAT Score? For 2023 graduates, the average SAT score was 1028, or a 520 in Evidence-Based Reading and Writing (ERW) and a 508 in Math.
This number only gives you some insight, however, into how you performed. Even if you’re above average, is your SAT score high enough to get into your dream school? Below, we break down what your SAT score means, the average results among different groups, and what this number means for your acceptance chances.
What Is the Average SAT Score?
For the 1,913,742 high school students who graduated in 2023 and sat for the SAT, the average SAT score was 1028 with a 520 in ERW and 508 in Math according to the 2023 SAT Suite Annual Report by College Raptor.
However, this only gives us a small glimpse into how the nation performed as a whole. The College Board provides percentiles so students can see how they compared to others, but also breaks down the data further into gender, test-taking history, race/ethnicity, and more.
Median SAT Scores – National “Average” SAT Scores
The College Board publishes a breakdown of all students’ scores on the SAT each year.
Rather than publishing an “average” SAT score specifically, they publish a chart that shows the percentile rankings of each different score range. What this means is that a student can find their SAT score on the chart and it will tell them both what percentage of students they scored higher than (their percentile ranking) as well as an approximation of what percentage of all students scored within their range (by subtracting the percentile).
The below percentiles represent the “SAT User Percentiles” from the 2023 SAT Understanding Scores PDF which “are based on the actual scores of students in the past three graduating classes who took the current SAT during high school. These user percentiles are reported on tests completed in August 2021 through June 2022.”
SAT Percentiles for 2022:
| SAT Composite Score (Out of 1600) | Percentile |
|---|---|
| 1600 | 99+ |
| 1550 | 99 |
| 1500 | 98 |
| 1450 | 96 |
| 1400 | 93 |
| 1350 | 90 |
| 1300 | 86 |
| 1250 | 81 |
| 1200 | 75 |
| 1150 | 68 |
| 1100 | 61 |
| 1050 | 51 |
| 1000 | 43 |
| 950 | 35 |
| 900 | 27 |
| 850 | 19 |
| 800 | 15 |
| 750 | 7 |
| 700 | 3 |
| 650 | 1 |
| 600 | -1 |
As an example, in this case, you can see that composite scores of 1450-1500 have a percentile ranking of 96 to 98, which means that if you scored within this range, you scored higher than approximately 96 to 98% of all students.
Therefore, the 50th percentile falls between the scores of 1000 and 1050, which is the “average” SAT score.
What Does Your SAT Score Mean and Why Does It Matter?
It’s natural to want to know how your SAT score compares to those of your peers. After all, many students end up applying to competitive and selective schools, where your score may mean the difference between being accepted and being denied.
The College Board also publishes a distribution of the SAT scores from all students. So, in a broader sense, students can at least get a general idea of how their score compares to all other students who sat for the exam.
However, in reality, your score doesn’t matter so much in comparison to all other students, but perhaps the most relevant question to ask is how does yours stack up against other students who are admitted to the colleges that you’re planning to apply to?
Colleges and universities around the country do publish this kind of information. Generally, they report the 25th and 75th percentile SAT scores of all students who are admitted in a given year.
So, while these aren’t “minimum” SAT score requirements (very few colleges have published minimums), they do give you an idea of what the admissions officers expect SAT scores of prospective students to look like. This can help you see what your odds of being accepted might look like.
Other Interesting SAT Stats
Average SAT Score by Race / Ethnicity in 2023
| Race/Ethnicity | % of Test Takers | Average Combined Score | Average ERW Score | Average Math Score |
|---|---|---|---|---|
| American Indian/Alaska Native | 1% | 901 | 458 | 443 |
| Asian | 10% | 1219 | 593 | 626 |
| Black/African American | 12% | 908 | 466 | 441 |
| Hispanic/Latino | 24% | 943 | 482 | 461 |
| Native Hawaiian/Other Pacific Islander | 0% | 925 | 473 | 452 |
| White | 39% | 1082 | 550 | 532 |
| Two or more races | 4% | 1091 | 556 | 535 |
| No response | 10% | 955 | 478 | 477 |
Source 2023 Total Group SAT Suite of Assessments Annual Report (collegeboard.org)
Average SAT Score by Gender in 2023
| Gender | % of Test Takers | Average Combined Score | Average ERW Score | Average Math Score |
|---|---|---|---|---|
| Female | 51% | 1023 | 532 | 500 |
| Male | 49% | 1032 | 517 | 515 |
| Another/No response | 1% | 1058 | 552 | 506 |
Average Test-Taking History
This table reflects the statistics based on the day the student took the exam. “School Day Only” refers to students who took the SAT as part of a State, District, or School testing initiative. “School Day and Weekend” refers to students who took the School Day test and an additional test on the weekend. Students under “Weekend Only” only took the test during a nationally offered SAT date.
| Day | % of Test Takers | Average Combined Score | Average ERW Score | Average Math Score |
|---|---|---|---|---|
| School Day Only | 53% | 922 | 471 | 451 |
| School Day and Weekend | 14% | 1134 | 574 | 560 |
| Weekend Only | 33% | 1154 | 576 | 577 |
“Average” ACT Scores at Each College
What may be more relevant to you as a student is not how you compare to all students who took the SAT, but how you compare to students who are applying to the same college as you.
“Is my SAT score good enough to get into UCLA?” you might be asking yourself.
If you want to get an idea of how your score compares, and an idea of what your admissions chances might be, then you can look at the distribution of SAT scores within a single college.
On College Raptor, we publish the 25th and 75th percentile SAT scores for all colleges that report it, so you can see how your score stacks up. Keep in mind that, again, these are not truly “average” SAT scores. Instead, they show you how about half of the admitted students scored. Based on this data, you can see that 50% of all students score somewhere within this range. But, it’s not a rigid guideline. Half of the students score outside of this range–about 25% higher and 25% lower.
Here are some examples:
University of California Los Angeles average SAT scores
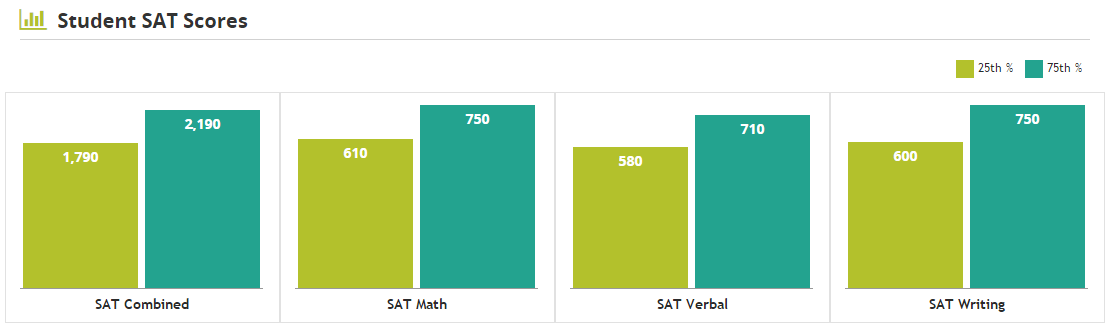
(via College Raptor)
Rice University’s average ACT scores
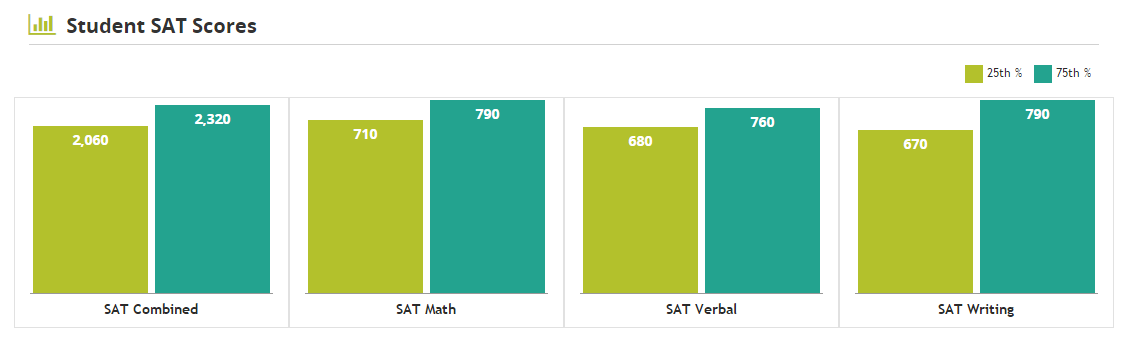
(via College Raptor)
Roanoke College average SAT scores
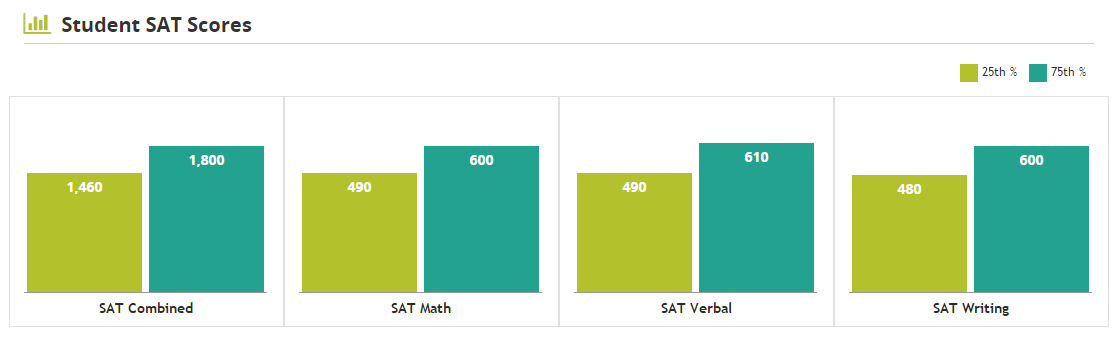
(via College Raptor)
Understanding the average SAT scores nationally and at your potential colleges can help you set your own goals for the exam. You’ll know what you have to shoot for. Which can give you the motivation you need to do better on the test. Aim for beyond the “minimum” or “average” though! Going beyond is just one of the many things colleges look for in their applicants.
Want to see how your SAT (or ACT) scores stack up against other students who were recently admitted to your potential colleges? Get started with College Raptor’s College Match tool to get all the data. You can also search for individual colleges using the search tool!