Ever wonder which US states students flock to go to college? It’s probably not where you expect.
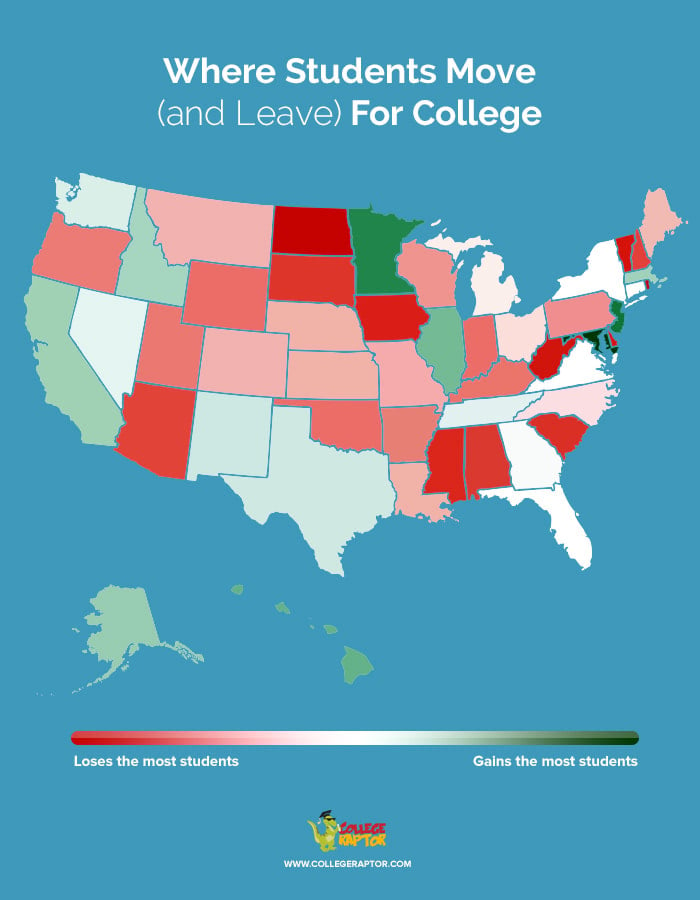
Students aren’t all migrating to warm weather or coastal US states (although many of them do pick up students each year). Instead, Rhode Island, North Dakota, and Vermont are the states that picked up the most students, according to our analysis of the latest available National Center for Education Statistics (NCES) data.
In our study, Rhode Island colleges enrolled 142% more first-year students than the number of first-year students from Maryland nationally.
Alaska picked up more students (by percentage) than California–with 23.7% and 22.1% increases, respectively.
Students from Minnesota, New Jersey, and Maryland show the most wanderlust in their college choice–their colleges all enrolled 38 percent or less than the number of college students they produced.
Many of the most populated states like New York and Florida remained near even, enrolling almost the same number of total students as they produced. But, there are some surprises that seem to stand out, like the fact that less populous states tend to pick up more students than they produce, perhaps due to lower out-of-state tuition costs.
Our analysis looked at all students enrolled in colleges within each state compared to the total number of reported students from each state, and didn’t look specifically at in-state or out-of-state enrollments.
College enrollment data by state
| State | Percentage Gained |
| Rhode Island | 142.12% |
| North Dakota | 80.98% |
| Vermont | 56.66% |
| West Virginia | 54.82% |
| Delaware | 52.78% |
| Iowa | 46.92% |
| Mississippi | 44.41% |
| South Carolina | 40.42% |
| South Dakota | 38.20% |
| Alabama | 35.89% |
| New Hampshire | 32.72% |
| Arizona | 32.53% |
| Indiana | 21.10% |
| Oklahoma | 21.03% |
| Wyoming | 20.99% |
| Kentucky | 19.58% |
| Utah | 18.83% |
| Oregon | 18.12% |
| Arkansas | 17.64% |
| Pennsylvania | 14.38% |
| Wisconsin | 13.40% |
| Missouri | 9.89% |
| Kansas | 9.80% |
| Louisiana | 9.77% |
| Nebraska | 9.72% |
| Montana | 9.63% |
| Colorado | 9.18% |
| Maine | 8.68% |
| Ohio | 4.38% |
| North Carolina | 4.21% |
| Michigan | 2.60% |
| New York | 0.12% |
| Florida | 0.03% |
| Connecticut | -0.70% |
| Virginia | -1.65% |
| Georgia | -3.02% |
| Nevada | -6.60% |
| Tennessee | -7.37% |
| Washington | -8.90% |
| Texas | -11.12% |
| New Mexico | -11.39% |
| Idaho | -16.88% |
| Massachusetts | -17.89% |
| California | -18.09% |
| Alaska | -19.16% |
| Illinois | -24.64% |
| Hawaii | -27.27% |
| Minnesota | -38.62% |
| New Jersey | -42.05% |
| Maryland | -60.25% |
About our methodology
This data was taken from an analysis of the latest available NCES data and includes a sampling of all reported enrollments for first-year students at individual non-profit four- and two-year colleges.
The data was then analyzed by grouping institutions by state and calculating the total number of students enrolled in colleges in each state, segmented by their state of origin. Finally, we used the total number of students from each state as a benchmark to calculate the percentage of first-year college students gained or lost by each state.