Colleges spend millions of dollars each year to market themselves and recruit students, with an average four-year private institution spending around $2,500 for each first-year student enrolled. Schools also spend millions more on their athletics to boost alumni giving and enhance the general appeal to campus culture. What kind of return, in terms of college enrollment, do athletics bring to campus?
With the NCAA Division I men’s basketball tournament about to tip-off, I decided to look at the past fifteen years of tournament participants to see what, if any, impact getting into the tournament had on new student applications and enrollment.
Better yet, how did tournament seeding and success influence student enrollment behavior?
This analysis is based on historical enrollment and application data reported to the National Center for Education Statistics and provided in the IPEDs database, along with an independent analysis of each team’s seed and each tournament’s outcome. All reported rankings are based on the most current (2015) College Raptor Overall Rankings.
Losing the National Championship may be better (for enrollment) than winning
Just about everyone, including Vegas, has Kentucky as the overwhelming favorite to win this year’s tournament. So, what growth can Kentucky this year’s national champion expect to see for their new student enrollment this September and in 2016?
Surprisingly, very little.
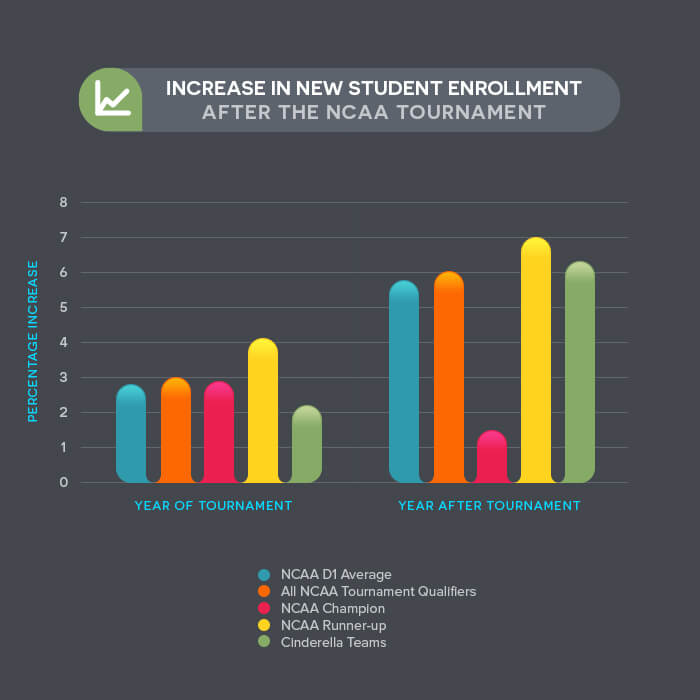
- National champions have seen an average of 2.9% growth in new student enrollment
- NCAA Division I average is 2.8%
- Oddly enough, it may be better to make it to the national championship game and lose. The runner-up in the tournament has seen an average of 4.1% new student growth
- What about Cinderellas, double-digit seeded teams advancing to the regional semi-finals (Sweet 16) or beyond? Their new student enrollment actually falls below the D1 average, coming in at 2.2% growth
- Just making the tournament? That helps a bit. The average tournament team sees one-year growth at 3.0%, which is actually better than national champion’s growth rate
But, since most application deadlines are before the field is set or a champion is crowned, the best measure of impact might be to look at the bump in enrollment for the second fall after the tourney.
So what about new student enrollment in the subsequent year?
- National champions two-year enrollment growth is a paltry 1.5%
- D1 average is 5.8%
- Tournament average is a 6.0% increase
- Cinderellas do see a bump, jumping up 6.3%
- The tournament runner-up dominates with a 7.0% new student enrollment growth.
It’s not the same thing as a national title, but there are enrollment managers and professors who would much rather see more students than a banner in the gymnasium.
Dance today, process more apps next year
As noted above, application deadlines often precedes the announcement of tournament field or the cutting down of the nets. However, teams making the tournament generally have a strong season and could generate increased applications as a result their regular season march to the tournament.
- For the first Fall after the tournament, the average D1 institution brings in 5.1% more applications than the previous year
- The average for teams in the tournament, however, clocks in slightly below that number at 4.6%
- National champions, on the other hand, see more than twice the applications as their D1 brethren, 10.4%
- Eventual runners-up get 6.5% more applications
- Cinderellas come in way below average at 2.4%
This doesn’t seem that surprising when you consider the timing. Since National Champions and runners-up are almost always highly seeded, they are most likely to have a great regular season, which drives apps throughout the admissions cycle. On the other hand, Cinderella teams aren’t likely to have grabbed as much attention earlier in the season, so they aren’t as likely to see a big boost in apps in the next immediate enrollment year.
But, does that additional spotlight in March pay dividends down the road?
You bet.
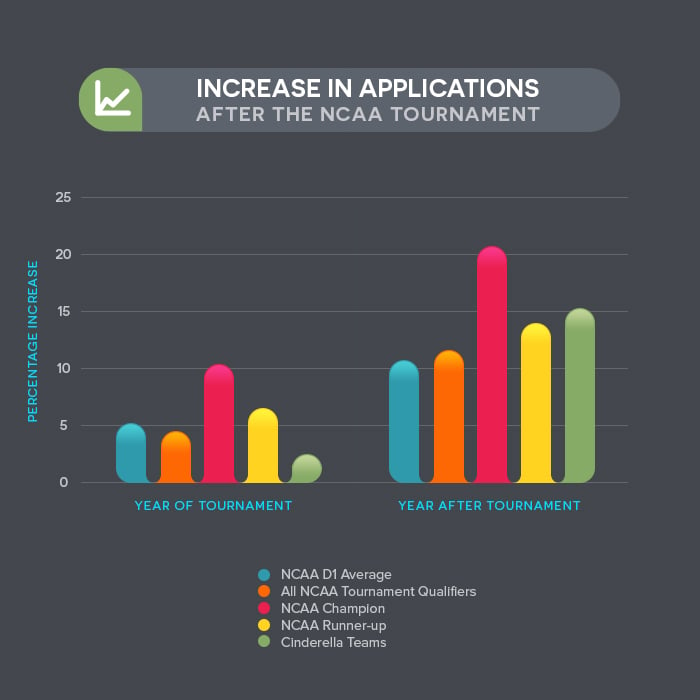
- D1 average is 10.8% application growth over two years
- Teams in the tournament clock in slightly above that mark at 11.6%
- National champions continue their success with 20.7% more applications
- Runners-up hit 14.0% growth in apps
- Cinderellas see a dramatic bump at 15.2% growth
Putting the applications and enrollment numbers together, though, it’s a mixed bag.
Winning the tournament seems to result in more applications than one would expect, but actual enrollment growth comes in lower than D1 averages.
A runner-up sees modest application growth, but greatly improved numbers when counting heads in September. Cinderellas appear to get a bump in exposure which grows application numbers and results in relatively modest enrollment success in year two.
In the end it appears that the most favorable position from an enrollment standpoint is still to make it to the NCAA championship and then lose. Second best is to make your mark as a Cinderella team.
But, those aren’t the only interesting findings to come from this analysis.
“Smarter” — better academically ranked — colleges are more likely to win
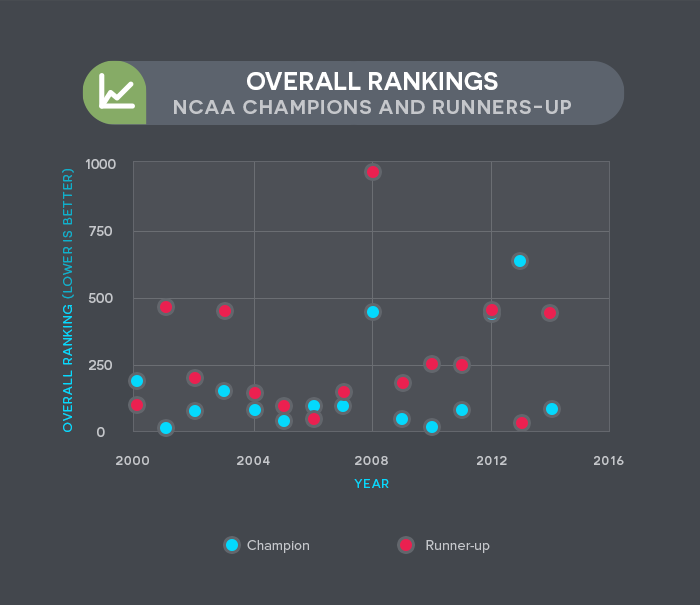
Does a school’s College Raptor Overall Ranking (based on academic and institutional health metrics) impact its chances of success? Well, in the national final there is a trend.
Over the past 15 years, the school with the better Overall Ranking has won 12 times — or, 80% of the time.
| Year | Median Overall Rank of Tournament | Champion | Champion’s Overall Rank* | Runner-up | Runner-up’s Overall Rank* |
| 2000 | 344 |  |
190 |  |
101 |
| 2001 | 289 |  |
16 |  |
469 |
| 2002 | 250 |  |
80 |  |
195 |
| 2003 | 304 |  |
160 |  |
453 |
| 2004 | 331 |  |
85 |  |
148 |
| 2005 | 431 |  |
47 |  |
91 |
| 2006 | 306 | |
101 |  |
50 |
| 2007 | 195 | |
101 |  |
139 |
| 2008 | 279 | |
453 |  |
973 |
| 2009 | 262 | |
47 | |
190 |
| 2010 | 250 | |
16 |  |
247 |
| 2011 | 247 | |
85 | |
247 |
| 2012 | 329 |  |
448 | |
453 |
| 2013 | 323 |  |
641 |  |
39 |
| 2014 | 284 | |
85 | |
448 |
Higher seeds get higher test scores
Does a school’s seeding reflect its Overall Rank or the average ACT score of its students?
It certainly seems that schools with better seeds tend to have better academic profiles.
| Tournament Seed | Median Overall Rank (2015 Rankings) | Median ACT (2015 Data) |
| 1 | 141 | 27 |
| 2 | 139 | 27 |
| 3 | 177 | 26.25 |
| 4 | 151 | 26.5 |
| 5 | 186 | 25.5 |
| 6 | 193 | 25.5 |
| 7 | 196 | 25 |
| 8 | 311 | 25.5 |
| 9 | 340 | 25 |
| 10 | 232 | 25 |
| 11 | 326 | 24.5 |
| 12 | 466 | 24 |
| 13 | 538 | 23.25 |
| 14 | 538 | 23 |
| 15 | 596 | 23 |
| 16 | 997 | 21.25 |
Seeds 2 and 10 are nice places to be
What impact does seeding play on enrollment numbers? No immediate trends pop out in new student enrollment or application numbers.
However, it does look good to be a 2 or 10 seed. Get excited, enrollment officers at, say, Gonzaga and Georgia.
| Tournament Seed | Year 1 New Student Growth | Year 2 New Student Growth | Year 1 Application Growth | Year 2 Application Growth |
| D1 Average | 2.8% | 5.8% | 5.1% | 10.8% |
| 1 | 3.1% | 2.0% | 5.9% | 11.5% |
| 2 | 4.2% | 8.3% | 5.6% | 12.4% |
| 3 | 2.8% | 7.3% | 4.5% | 14.6% |
| 4 | 6.9% | 7.5% | 3.5% | 10.3% |
| 5 | 1.2% | 5.5% | 5.0% | 12.0% |
| 6 | 0.3% | 1.5% | 7.3% | 13.3% |
| 7 | 4.2% | 9.0% | 5.3% | 10.2% |
| 8 | 0.2% | 1.8% | 7.5% | 14.5% |
| 9 | 1.4% | 5.4% | 5.2% | 9.7% |
| 10 | 3.2% | 7.1% | 6.3% | 12.8% |
| 11 | 1.1% | 9.7% | 4.6% | 7.5% |
| 12 | 6.6% | 8.6% | 3.1% | 9.8% |
| 13 | -0.4% | 2.0% | 5.0% | 13.6% |
| 14 | 0.7% | 3.2% | 1.1% | 5.5% |
| 15 | 5.3% | 9.0% | 2.1% | 8.7% |
| 16 | 6.5% | 7.2% | 2.1% | 13.3% |
My predictions for this year
It’s no fun to look at previous tournament data without making predictions about this year’s tournament.
While I’m no Nate Silver, I feel confident saying that this Fall’s new student enrollment at schools with a team in the tournament should outpace the institutions that aren’t dancing today. Applications and new student enrollment numbers for Fall 2016 should grow as well.
Prepare yourselves to handle the extra interest in your institution, especially if your team makes it to the championship, but loses (to, maybe, Kentucky?) or if the glass slipper fits for a double-digit seed over the next few weeks (come on, Valpo!).